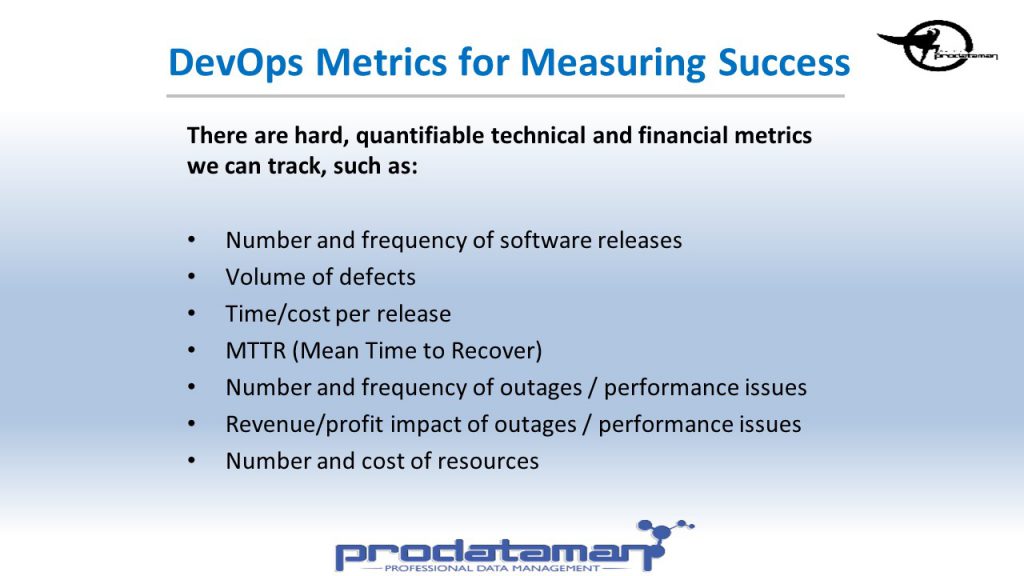
What I find most compelling about the DevOps metrics listed below is the fact that control of almost all of the metrics can be gained by mastering the first metric in the list. The metric that seems to tame all others is the Number and Frequency of deployments / software releases. If we strive for the seemingly extreme goal of 10+ Deploys per Day the milestones that we much achieve to reach this goal end up covering all of the remaining metrics. For example, if we are able to deploy 10 times per day without losing or pissing off every single one of our customers we must have reduced the volume of defects, number and frequency of outages as well as cost of those outages. As the story goes in order to deploy 10 times a day most everything in the delivery pipeline needs to be automated therefore automated testing should reduce the Number of Defects and the cost associated with fixing them. By the same token if the deployment is automated the Number and Cost of Resources associated with deployment should be reduced. Lastly in order to deploy 10 times during a normal workday of 8 hours (480 minutes) our deployments must be done every 48 minutes. If we intend for our customers to actually use our solution the actual deployment must take significantly less than 48 minutes! As a result, Mean Time to Recovery and Mean Time to Change must go down as changes and fixes can go out in the next deployment within 48 minutes.
Number and frequency of software releases
Volume of defects
Time/cost per release
MTTR (Mean Time to Recover)
MTTC (Mean Time to Change)
Number and frequency of outages / performance issues
Revenue/profit impact of outages / performance issues
Number and cost of resources

